
Sandesh Ltd. is available at 113.00 rupees (28-Mar).
Sandesh Ltd. has an NCAV of 111.45 rupees.
The scrip has cash per share of 26.60 rupees which is very good. It has a good market share in Gujarat where it is now the #3 newspaper (from #2, a year ago). At these numbers, prudence has it that the stock will go up however from an investing viewpt, the following needs a look into -
a) Sales have dropped; so have profits
b) Didn't declare any dividend last year
c) There was a sudden spurt in sales last yr (from nowhere we has a number of 635 crs in the financial statement)
d) Q3, 2005 was a negative profits quarter
e) Fwd PE comes to 17.20 (but very inconsistent profits)
So although this stock gives me fantastic margin-of-safety, it doesnt give me the comfort of a consistent and growing earnings growth. If anyone's been tracking this stock, then opinions are soughted.
Tuesday, March 28, 2006
Sandesh Limited
Bookmark this post: | 
|
Sunday, March 26, 2006
For just a penny more, or maybe a penny less
1. Abbott India is range bound. There is support for the scrip at 625 rupees and has a resistance at 700 rupees (level 1) and 725 rupees (level 2). The scrip is current available at 640 rupees. Advise punters to buy with a stop-loss at 620 rupees. The Q1 results of the company are due on 31st March 2006. There will be some traction in the stock then.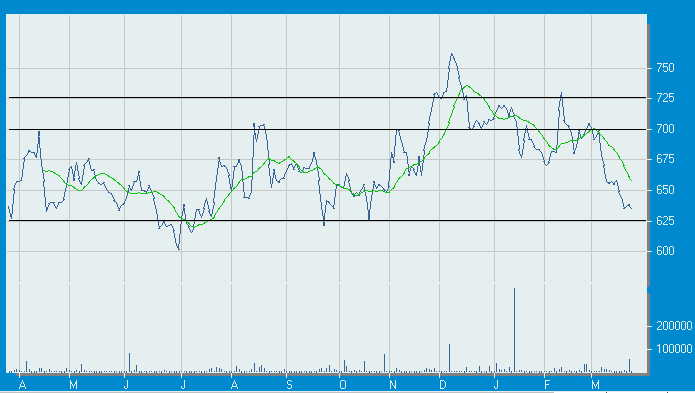
Fundamentally, profits have been lower than LY and at a CMP of 640, fwdPE comes at 16.12. The NCAV of the stock is 101.94 rupees. The company has declared a dividend of 17.5 rupees only (it was 35 rupees last year; the announcement came early this month .. and hence the rapid fall in value from 700 to 640. Yet the dividend yield stays at 2.76%). Sales are growing at 12% p.a., all quarters have been profitable (at over 10 crs a qtr) and management is good.
2. Helios & Matheson's stock value has been on a down trend due to a news item. Infact 13th Feb was a rather volatile day for the scrip. It opened at 220; reached a high of 254.90; fell to a low of 200 for the day and closed at 249.15. The news was w.r.t. to some arbitration proceedings over one of it's subsidaries vMoksha.
The company has a marginally negative NCAV. What's remarkable is the rising revenues and profits of the company which went up 90% and 140% respectively. My calculations of the fwdP/E come to about 10.58. Traders can look at an exposure in this scrip with a stop loss at 170 rupees.
There are a number of stocks which have seen a reduction in prices over the last one month or so, however you and I'll be comfortable with the one where fundamentally the stock is sound, while external events which can be controlled are responsible for the lowering in value.
Bookmark this post: |
|
Friday, March 24, 2006
The Framing of Decisions and the Psychology of Choice
The following text is an adaptation of a 1981 Science paper, “The Framing of Decisions and the Psychology of Choice” where Tversky and Kahneman presented a glorious example which delve in the psychology of making a rational decision among seemingly-diverse options.
Imagine the Avian flu disease has now been discovered in Sri Lanka and is expected to kill 600 people. Two alternative programs to combat the disease have been proposed.
1. Under Program A, a projected 200 people will be saved.
2. Under Program B, there is a one-third probability that 600 people will be saved, and a two-thirds probability that no one will be saved.
Which one will you go in for - Program A or B?
The researchers then restated the problem: this time, with -
1. Program C, “400 people will die”
2. Program D, “there is a one-third probability that no one will die, and a two-thirds probability that 600 people will die.”
Now, which one will you go in for - Program C or D?
PS: The authors observations are given in the comments. Please have your answer ready before peeking through the comments
Bookmark this post: |
|
Monday, March 20, 2006
It's getting better all the time
I'll be closing 2 years of investing on the equity markets this 31st March. Confession - I have made much less money than what an index fund would have given. But have learnt a lot in the process. How I missed many an opportunities? And again missed the same opportunities? When to sell and not to sell? Buy or not buy and buy how much? Im still ridden with a number of stocks which have dimished 40%+ in value.
OK, this may be amusing ... the first ever stock I bought on the equity market was Padmalaya Telefilms and this was also the very stock I sold off at a loss ... a loss of 63% from cost.
But the truth is: I am very much getting better at this. In evaluating companies, on the right time to buy, am seeing more in the B/S and P&L and the importance of news and volumes. My choices and recommendations in the last one month have been much better than ever before.
> Amtek India in 37 days, is up 18%
> Gujarat NRE Coke in 33 days, is up 10%
> Aftek Infosys in 3 days, is down by 1%
> Ind Swift Labs in 1 day, is up 16%
Bookmark this post: |
|
Saturday, March 18, 2006
News, prices and tale spin - Visualsoft Tech
Visualsoft Technologies Ltd. made a press release on the 17th of March, 2006 stating that - they are no longer going ahead with the amalgamation of the two other pvt companies with Visualsoft Technologies Ltd. Another relevant info in the same news item was - Mr. Sashi Reddy has resigned as the CEO of the company.
The charting below shows the performance of the stock.
The stock price has taken a serious dent from it's Jan4th levels of 260 rupees and is today almost 50% below that price. Notice the strong volume of 1.75 million on 17th March 2006 because of the news that the amalgamation has been aborted and the resignation of the CEO of the company. On that day, the stock fell from 162 rupees to 138 rupees.
Financially, the specs of the company are enclosed -
Share capital - 19.98 crs
Loans - 0.00 crs
Investments - 0.00 crs
Net current assets - 154.10 crs
FV - 10 rupees per share
Dividend - 2.50 rupees per share
CMP - 138.65 rupees per share (17-Mar)
LY profit - 28.34 crs
Lets make some inferences from this -
1. NCAV for Visualsoft Technologies is a fantastic 77.13 rupees/share (the CMP less than 2x of the NCAV)
2. Cash with the company is 54 crores i.e. 27.02 rupees of cash per share
3. Zero debt company (cash rich - zero debt is a lethal combination !!!)
4. Dividend yield would come to 1.79%.
Now the problem areas -
1. While sales in Q1 and Q2 increased by 14% and 15% respectively over last yr, the Q3 sales actually dropped by a huge 41% over last yr
2. Profits for Q1 fell by 24% over last yr, for Q2 fell by 6% over last yr and for Q3 fell by 41% over last yr
3. Estimated profit for the year is only 19 crores for the company which means a P/E of 14.72. (a P/E of 14 is available with other peers aswell who although donot have this fantastic NCAV that Visualsoft holds, but have more stable earnings)
4. The profits are well below my 10 crs per quarter rule.
5. and ... I have the slightest idea how the stock will behave over the next 3 days.
Mar-17 saw huge volumes on this counter and massive decline. March 20th can be a make or break. Amazingly, this is the same company which was listed in Forbes as one of the Top 200 Small Companies in the world.
Questions for you -
a) Is Visualsoft under / fairly / overpriced at rupees 138.65?
b) Will Visualsoft go further down in price over the next week or so? If yes, how much? If not, why not?
c) Is there some appreciation to be seen in the price of the stock over the next 3 months / 1 year from today?
An additional question - investing in which stock is preferable ... a Visualsoft which has a great NCAV but sparse earnings record or an NIIT Technologies which has no NCAV but a consistent and growing earnings record?
Bookmark this post: |
|
Friday, March 17, 2006
What a tip !!!
A friend called up this evening to discuss a tip he received from his broker - Buy Ramco Systems. The reason being - the stock is at it's 52-wk low of 193 rupees and it's 52-wk high was a huge 519 rupees. He said, the stock had mighty upside as buying levels will increase. I checked out the numbers and was absolutely taken aback with the financials. Enjoy this !!!
a) The company has been in the red for six out of the last eight quarters
b) The P&L account of the company shown a loss for the last 4 financial years
c) Personnel expenses account for 40% of the total sales of the company
d) No dividend for the last 5 financial years (obviously)
But that's not the shocking part ....
Check the prices over these last eight quarters. I have taken the highest price within one month of the close of quarter (these are the times when the financial statements come out)
Mar-04: Profit of 4.21 crs; Price was 265 rupees
Jun-04: Loss of 9.29 crs; Price was 250 rupees
Sep-04: Profit of 2.32 crs; Price was 290 rupees (the price increased while profits dipped)
Dec-04: Loss of 3.36 crs; Price was 440 rupees (the price increased while profits dipped)
Mar-05: Loss of 30.04 crs; Price was 425 rupees
Jun-05: Loss of 6.03 crs; Price was 405 rupees
Sep-05: Loss of 7.11 crs; Price was 450 rupees (the price increased while profits dipped)
Dec-05: Loss of 3.68 crs; Price was 330 rupees
From 13-Sep-2005, when the stock reached a high of 546.70 rupees ... it has been steadily declined and it today (22-Mar-2006) at 194.25 rupees. A decline in value of 64.46% in a little over 6 months. Amazing tip, aint it?
Bookmark this post: |
|
Ind Swift Lab
Ind Swift Labs moved UP by 15% today. I bought the stock yesterday.
It's not often that I write a statement like this. Fluke .... (no wait) ... big fluke !!!! ... not buying the stock, but the sudden jump
Share Capital - 20.90 crs
Loans - 145.35 crs
Investments - 3.14 crs
Net CA - 88.16 crs
FV - 10.00 rupees per share
Dividend - 1.50 rupees per share
CMP - 115.00 rupees (Mar-24)
LY Profit - 26.59 crs
Why I bought Ind Swift Labs?
1. I estimate a closing yr profit of 35 crs i.e. a P/E of 6.87.
2. Growing profits and sales for the last 5 years (YoY (04-05) growth in profits was 300% and sales was at 55%)
3. The sales growth numbers (qtr-on-qtr for 2004 and 2005) show a progressive story -
a) March - 45.22 crs v/s 83.22 crs (84% increase)
b) June - 44.00 crs v/s 79.97 crs (82% increase)
c) September - 45.48 crs v/s 80.28 crs (77% increase)
d) December - 66.75 crs v/s 82.36 crs (24% increase)
4. Profits have also moved in a positive direction, though not on similar constants - 251%, 18%, 21% and 418%.
5. Dividend yield is 1.30%. I expect a higher dividend payout of 2.5 rupees per share i.e. a dividend yield of 2.17%.
6. Excellent news value
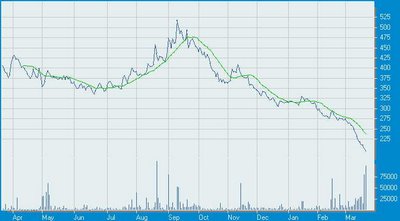
7. The final blow was dealt by the charting of the scrip. Notice the fall in the share from 210 rupees, an year back to half that price today. The big avalanche started from Jan 18th (170 rupees) till it reached it's low of 97.60 on March-23rd (yesterday).
Please note that Grahamian numbers will not purport a buy for the stock because of the negative NCAV of 25.86 rupees, low cash in company and high debt. I find the management good, an enticing price even at 115 rupees (imagine, I bought it yesterday at 97 rupees) and excellent growth prospects.
Bookmark this post: |
|
Thursday, March 16, 2006
Savita Chemicals
Pl keep this scrip in your watchlist
I'll start with 'things-that-hurt' on this scrip. The stock -
a) Is rather close to it's 52-week high
b) Is below my 10 crs a quarter rule
c) Is fairly above it's NCAV (4x above)
d) No news value
Now, what I like about this stock.
a) Savita Chemicals has improved in sales and profits by 20% for the last three quarters
b) It's fwdP/E ratio is 11.08
c) The company hardly deploys debt in it's balance sheet .. just 20.24 crs
d) Cash in the company is 21.66 rupees per share. Not much, but good enough to convince me of another dividend ... of atleast 12 rupees.
e) Dividend yield would come to 2.33%
The charting of this scrip has me stumped. Savita Chemicals has virtually no volumes to speak off, however it has consistently grown in the stock market. Price on 16-March-2004: 100 rupees; Price on 16-March-2005: 235 rupees. Only one dip - in the month of Nov 2005 when it went down to 275 from 375. I feel the stock will fall down to 350 rupees and not more ... sooner or later. It might be a good idea to pick a small stake once the stock touches 375 rupees to a share.
Bookmark this post: |
|
When probability doesnt make sense
You enter your plush office this morning and are greeted with a phone call from your broker. He wants to play a game, and feels you are the right player for this little experiment. He explains the rules - you shall toss a coin and call for a heads or tail. If your call is correct, then i'll double the money in your wallet. However, if you call wrong then i'll halve the money. If you dont participate in this game, the eccentric broker would give you 100 rupees.
What he doesn't know is that he is dealing with a mathematics stud from your school days and such problems are small-fry for you. Being the champion of probability, you pick your pen and try to simulate the problem ...
a) You assume that you hold 1000 rupees in your wallet
b) If you call right, the 1000 rupees become 2000 rupees.
c) If you call wrong, the 1000 rupees is down to 500 rupees.
d) In both cases, the probability of the event happening is 0.5
Simple equation .... X = [probability of (1000)*two + probability of (1000)*half] - 1000
or, X = [(0.5)*2000 + (0.5)*500] - 1000
or, X = [1000+ 250] - 1000
or, X = 250
Brilliant, you say. X is 250 rupees which is greater than 100 rupees (for non-participation). So, I must participate. Its a clear arbitrage of 150 rupees.
Think a little further .... You've participate in the game based on this probability analysis. What next? .... The use of probability analysis to aid you in decision making of participation in the game is only secondary. What's more important is how probability helps you in arriving at the correct call so that you can double your money.
To illustrate, imagine you had called wrong. Your purse would have been lighter by 500 rupees, although your profound mathematical skills would beg to differ on your interpretations of loss.
OK, think still further ... the broker has tossed the coin which lands on his palm. He hasn't shown you the result. Remember, you have used your probability skills to arrive at the logic that you have 150 rupees of "free money" to be made by participating in the game. He now gives you a second chance ... he says "I give you an option for you to not take this fall of the coin. You can tell me to toss the coin again.". You do your round of mathematics again and arrive at the same 150 rupees advantage. This still holds true. But what is the use?
By now you would have realised that the deal was inconsequential when we used probability analysis to the problem. Perhaps, just taking the 100 rupees was a better deal.
Adapted from "The Two Envelopes Paradox" by Keith Devlin
Bookmark this post: |
|
There's something about Aftek
Aftek Infosys stats are enclosed -
Share Capital - 17.06 crs
Loans - 129.54 crs
Investments - 59.59 crs
Net CA - 374.40 crs
FV - 2.00 rupees per share
Dividend - 1.00 rupee per share
CMP (22-Mar; 10:05 am) - 78.45 rupees per share
LY Profit - 59.80 crs
Hence,
a) The NCAV (excl invt) comes to 28.71 rupees per share, which is quite excellent for an IT company (pl revert to the blog on Visualsoft Tech where Prasanth, Ravi, Rohit and me blew away the NCAV technique for evaluation of IT companies).
b) Sales and profits have been rising at 25-30% every year and this year is also no different.
c) Dividend yield comes to 1.30%
d) EPS comes to 7.01 rupees per share
Some other inferences ....
1. Loans are very interesting. Unbelievably, Aftek Infosys had been debt-free for the last 3-4 years. From nil debt last year to 129 crs this year would raise eyebrows. However, when I look at this number on the basis of capability to service debt ... the company is well on cue. At 129 crs, the interest cost would come close to 13 crs for the year (at 10%) and with the company earning 60 crs of profits per year, servicing this amount is not an issue (at an interest coverage of 4, the company would have a AAA rating with 150 crs of debt). The debt has been raised through the FCCB route.
2. I expect this NCAV to come down in the next annual report due to the major component of this NCAV is cash (328 crores or 38.45 rupees/share). Aftek would ideally be using this cash to acquire other businesses across the world. The fact that Aftek already has enough profits to take care of it's debt servicing, would mean it can deploy as high as 80% of this cash for acquisitions. If I assume 60% deployment, then the outflow of cash will be 196 crs or 23.07 rupees/share of cash. So the NCAV should come down to 14.86 rupees/share in the next annual report, ceteris paribus.
3. Consequently, investments would increase because of the increase in stake with Arexara Information Technologies Gmbh and V-Soft.
4. I expect a stronger dividend payout by the company inspite of the increase in share capital. The dividend payout may well be close to 75% for this financial yr which improves the dividend payout marginally.
5. The financial year has been changed, so it makes sense for us to see quarterly numbers. On this basis, I find that the fwdP/E of the company should come to 10.08 which is truly excellent.
Whats changed? ... see the charting below.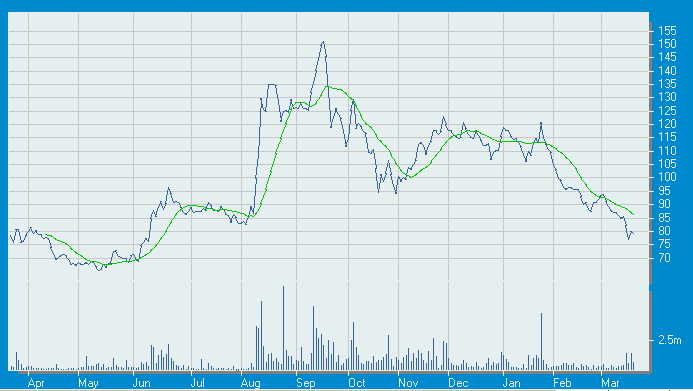
The stock seems excellently priced, a good management, concrete business plans ... all in the making of a good buy.
Bookmark this post: |
|
Wednesday, March 15, 2006
Pricol Limited
I examined the nine-month financial statement of Pricol Ltd.
In summary,
a) The sales have increased marginally (7.4%) over the nine-month period in the last FY (2004).
b) Correspondingly, the PBT have fallen significantly (from 43.9 crs to 28.6 crs; a drop of 34.8%)
c) Notice the rise in interest cost. The nine month interest cost is at 8.43 crs while the financing cost was 4.87 crs in the previous FY. (a 73% rise)
d) Net profit after tax, dep and interest (PAT) is at 22.9 crs while it was 28.09 crs for FY2004-05.
The balance sheet reads ...
Share Capital - 9.00 crs
Loans - 155.90 crs
Investments - 14.75 crs
Net CA - 86.13 crs
FV - 1.00 rupees per share
Dividend per share - 1.00 rupee
CMP - 39.75 rupees/share (15-Mar)
Thus, the NCAV (as per 2004-05 balance sheet would come to negative 7.75). Estimating trends in FY2005-06, I find ...
1. The profits for the year should be around 29 crs. This would mean a P/E of 12.08 on todays CMP.
2. There is no margin of safety here. The NCAV is infact, negative.
3. The company would be in a position to give a dividend of 75 paise only this yr due to the lower earnings. This comes to a 1.89% dividend yield.
4. There is no news of value on the stock too - although it has decent volumes on the bourses.
My take - this stock will not move much from this level for the next few weeks. Further improvements in the stock price will be a function of news or increase profitability. There is no hidden value in the stock that is visible.
PS: I think the company is resorting to some creative accounting practices here. Picture this (look at the annual report) -
> In 2003-04, the company had borrowings of 115.23 crs on 31-Mar-2004 and had accounted for an interest cost of 8.02 crs. Which means we are looking at a financing cost of 7.5%. Fair.
> In 2004-05, the company had borrowings of 155.90 crs on 31-Mar-2005 and had accounted for only 6.83 crs .. a financing cost of only 4.4%. At 7.5%, this should have been around 11.69 crs.
> For 2005-06, the interest cost would close at close to 13 crs. I would like to assume that the increased financing cost is making up for the lower accounting of interest cost in the previous financial year. So, loans would not have increase too much this year. Lets estimate it at around 160 crs.
Bookmark this post: |
|
Tuesday, March 14, 2006
Fantastic P/E ratios ( .... low, figuratively !!! )
You might want to research some of these stocks. They have a fairly good market capitalisation and a rather strong P/E ratio amongst their industry peers. I found these in some old files .. seems to be January 2006 data.
I have marked the ones which have shown increasing Q-on-Q profits over the last three quarters in green for your reference. We'll evaluate these over the next two weeks.
Madras Aluminium [12.58]
Pheonix Lamps [10.78]
Pricol [10.58]
Eicher Motors [2.78]
Ashok Leyland [13.48]
Punjab Tractors [10.86]
Bank of Baroda [12.17]
Federal Bank [5.65]
SBI [10.02]
Jupiter Biosciences [6.65]
JK Lakshmi Cement [10.11]
Everest Industries [9.33]
Gujarat NRE Coke [7.42]
India Glycols [6.17]
Savita Chemicals [9.35]
Jaiprakash Associates [13.02]
Nava Bharat Ferro [6.45]
Havell's India [17.09]
LG Balakrishnan [16.09]
Kirloskar Oil Engines [6.50]
GNFC [6.59]
GSFC [6.25]
Mangalore Chemicals [5.85]
GAIL [9.86]
Mascon Global [11.79]
Tata Elxsi [19.22]
Tinplate [5.30]
Adani Export [12.46]
Atul [12.35]
Dredging Corporation [11.79]
Gujarat Alkalies [4.84]
MIRC Electronics [7.23]
Su-Raj Diamonds [7.95]
LIC Housing Finance [9.34]
Shriram Transport [8.42]
Tata Investment Corp [8.90]
ONGC [11.07]
JK Paper [7.97]
West Coast Paper [7.11]
Rallis [9.38]
IPCL [5.30]
Ind Swift Lab [8.18]
Aarti Drugs [9.06]
Merck [11.99]
Shasun Chemicals [13.71]
Torrent Power SEC [8.73]
Infomedia [8.14]
Bongaigoan Refineries [7.00]
Chennai Petro [5.14]
Mercator Lines [4.82]
Varun Shipping [5.77]
Bhushan Steel [4.30]
Monnet Ispat [6.40]
Essar Steel [1.58]
Lloyds Steel [1.78]
Mukand [2.61]
SAIL [4.15]
Mawana Sugar [12.51]
Avaya Global Connect [13.94]
MTNL [10.96]
Alok Industries [10.74]
Nahar Export [6.56]
KEC International [4.58]
Apollo Tyres [14.96]
Bookmark this post: |
|
Monday, March 13, 2006
What are the odds? (South Africa - Australia)

.... and still have to bite the dust
Bookmark this post: |
|
The greatest cricket ODI ever played

Bookmark this post: |
|
Sunday, March 12, 2006
Venus Remedies
2. GM Breweries
Venus Remedies was a turnaround story (sort of) and hence commanded Stockpaisa.com's patronage as the stock-pick. A quick-peek of GM Breweries reads a similar story.
a) LY sales were 104.33 crs; this year the company may close with 155 crs
b) LY profits were at 0.75 crs; this year the company should close at 9 crs
c) Again, an NCAV one would have zero comforts on (negative 22.84)
d) Surprisingly, this company doesn't subscribe to making many an announcements as in the case of VR.
I would again quantify this stock as a may-be-superhero stock and is more for aggressive investors and not conservative ones like myself. The price target given by stockpaisa.com for this stock is 120 rupees in the 3-5 month horizon.
The stock did reach a high of 89.35 rupees to a share and is currently at 71.2 rupees. The 52-wk low is 16.60 rupees/share. The charting of the scrip shows some inconsistent volume movement. The current trend shows that volumes are a bit on the decline .. but this can abviously change anytime.
3. Areva T&D India Ltd.
When I last researched this stock (Feb 25), the stock price was 468.00 rupees. I found it a bit expensive then. Today it is at 746.40 (Mar 10). The stock jumped 59.6% in 15 days.
Lets examine the stock stats -
Share capital - 39.89 crs
Loans - 1.58 crs
Investments - 9.65 crs
Net CA - 128.38 crs
FV - 10.00 rupees per share
Dividend - 1.75 rupees per share
LY Profit - 21.20 crs
Est profit for this FY - 50.00 crs
CMP - 743.00 rupees per share
On the basis of the above -
a) NCAV of 34.21 rupees / share
b) Dividend yeild of 0.24%
c) fwdP/E of 59.28
Any news value? Heavy ... the group is hiving off it's motor business, amalgamation etc. The company has some very good sales and profits to show for the last 3 quarters. The current volume trend suggests a little further movement up in the stock before a possible correction (afterall a P/E of 60 might be a bit difficult to sustain esp. when the industry is at around 34 levels)
Bookmark this post: |
|
Saturday, March 11, 2006
Property wisdom
"The whole of Delhi is into properties", said the property broker, who took me for a spin this Saturday. Clever buggers these guys ... they'll do their best to ensure that he thinks my money as his onw, he would say that he'd sell our flat to another buyer at a little higher rate (it's another story that he might do the same thing to me aswell) .... that's their way to gaining confidence. Traits of a professional salesman.
Some tips I could remember -
a) Always go in for smaller property sizes as compared to bigger property sizes. It's easier to sell and often has the best appreciation in value
b) Plots are preferable over flats if quick returns are your goal. Plots are easier to sell as compared to flats.
c) In flats, the variation in prices is not as much as compared to plots, where location and frontage is of primary significance
d) If you are searching for one (plot/flat/house), there will always a second broker who would give you a better deal. So search more, and seek more.
Bookmark this post: |
|
Friday, March 10, 2006
Stock picks by Stockpaisa.com
Stockpaisa.com has given it's list on price targets in it's website. The list has been worked keeping positive ripples from the budget into perspective and the technicals / fundamentals of the company.
The top five in the list with expected returns over the next 3-5 months are -
1. Venus Remedies - 61%
2. GM Breweries - 58%
3. Areva T&D India Ltd. - 54%
4. Astra Microwave Products Ltd. - 49%
5. Flex Industries Ltd. - 49%
Let's examine a few of them in this post -
1. Venus Remedies
VR is not a Grahamian stock, by a long shot. It's NCAV is at 5.76 while it's CMP is at a fairly high 363.00 rupees per share. With a dividend yeild of 0.28%, I was kinda wondering what makes this stock command such a high valuation. That was when the news element of the stock bundled me ....
a) 12-Dec: VR in talks with MNCs over drug licensing (Cephalosporins combination)
b) 15-Dec: VR has appointed a senior scientist
c) 16-Dec: VR sets up wholly owned subsidary in Germany
d) 27-Dec: VR broad bases Board
e) 3-Jan: VR filed third PCT International Application
f) 17-Jan: Venus Remedies up on Q3 (we'll examine this aswell)
g) 31-Jan: VR acquires pharma unit in Germany
h) 20-Feb: VR filed fourth PCT International Application
i) 8-Mar: VR to consider issue of FCCB
Financially, here's where the company stands -
a) On profits - LY profits were a miniscule 4.1 crs. However this year has been a different story. Q1+Q2+Q3 profits currently stand at 10.81 crs. Extrapolating the numbers, the profit for the year should be on around 16 crs. Which means an EPS of 24.96 rupees/share.
b) The fwdP/E of the stock is at 14.54 which is fairly lower than other emerging pharma companies
c) Sales are going at a doubly pace (a bit more than that) ... LY sales were at 30.83 crs while this year (in 3 qtrs), the company has reached 62.06 crs. At this scoring rate, the company should close at around 90 crs of sales for this FY.
Now, what makes me think again ....
a) All this news ... where did this come from? You might want to read the announcements in BSE. Venus Remedies has close to 50 announcements at the BSE in the last 365 days. (Dr. Reddy's had around 60 announcements in the same period)
b) There is no margin of safety in the stock for comfort. At an NCAV of 5 and a book value (LY) of 23.55 rupees per share ... a CMP of 363 would mean .... (both LY numbers)
1. P/BV ratio of 15.41 and,
2. P/Sales ratio of 7.5
c) And ofcourse, you know my disapproval to any stock who would not give me 10 crs of profit to the quarter. VR is well below that mark.
However, this is not to dissuade you from purchasing the stock as a not-that-far-feteched-bet. The big question is ... when to buy and how does this stock move. Answers to this can be obtained from the charting given below. Interesting trends, these ...
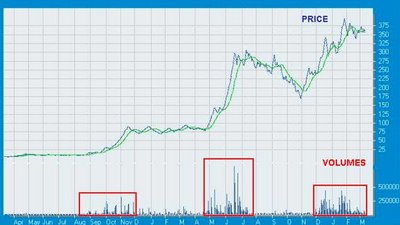
The stock first started moving in the September of 2004. It moved for 4 months (till Dec 2004), post which the stock was silent for 5 months. Again in May-2005, huge volumes moved up the stock to touch 300 rupees per share. This continued for 4 months (till July 2005), post which a lull set in for another 5 months. Another spurt has been seen this Dec onwards. It's been on for Jan, Feb and Mar ... 4 months again. What's your take for the next 5 months?
Bookmark this post: |
|
Meaningful answers
Which drink tastes better - Coca-Cola or Pepsi? In a recent focus-group discussion, a market research company asked this question to a 100 people and of them, 90 said Coca-Cola while 10 said Pepsi. To further understand if people are able to distinguish between the two drinks on the basis of it's taste, the agency asked 5 volunteers from the "i-love-pepsi" group to sip 5 bottles of the blank-labeled cold drinks presented to them, and tell us the right drink. Amazingly in 4 out of five occasions they got it right.
Conclusion : 80% of all people are able to identify the taste of the drink they are having and 90% say Coca-Cola is better.
Let's revisit this - 0.8 is the probability of a person identifying the right drink which means he/she has a 0.2 probability of doing the opposite (reading the wrong drink). Which means, of the 90 Coca-Cola afficionades, it's possible that 20% of them would have got their taste wrong i.e. although they say "I-love-Coke", they would have selected Pepsi from the draw. Simialrly, the Pepsi group of 10 would have 2 people who would have tasted a Coca-Cola as the superior taste. So we have 16 "CC to P" people and 8 "P to P" people = 24 "I-love-Pepsi" people
Or, not 90% of the people love Coca-Cola but only 76%. And Pepsi goes up from 10% to 24%. Consequently, the probability of a Pepsi lover choosing a Pepsi from two drinks after sipping it, is only 8/24 = 0.33
Bookmark this post: |
|
Thursday, March 9, 2006
Player 1 v/s Computer
This isnt a Playstation game or the latest version of International Cricket Captains (ever tried this computer game .. it's amazing !!!). Just an extension of Devlin's piece on "A Game of Numbers". Devlin in this treatise has described how Oakland Athletics won the Western division of baseball in 2000, 2002 and 2003 with a team which had no 'A' cat super-stars ... a team which was just a summation of individuals with specialised skills.
Here's how they did it -
a) The initial premise was that unlike football (american style), baseball didn't require excessive teamwork. The pitcher pitches depending on his individual skills, the batter plays using his own skills and the out-fielder fields the ball unguided by other individuals. This is somewhat similar to what happens in a game of cricket.
b) Over time some 11 million batter-pitcher confrontations have occurred in 150,000 games. Thats a world of data to analyse. Coupling this data with random elements of pitches, weather, toss etc. you can create patterns w.r.t. which position to send each batsman, batsman can play a spinner or a faster bowler better, condition training schedules accordingly, individual tactics, patterns on how a bowler balls his first two balls and the last two balls (i've always noticed that the first two balls of any pace bowler are never the slower ball) etc.
Reading the article I came across some really wonderful notes, worth putting down here -
1. Batting averages are now generally regarded as a poor guide to performance - not least because they do not distinguish between a single, double, triple, or boundary; or how many players scored runs on a mis-hit or after being dropped or narrowly escaped being out.
Also, averages are rather misleading. Analyse this -
In the 1997 season, Jacques Kallis played 14 matches and scored 560 runs while Rahul Dravid played 35 matches to score 1350 runs. Assuming both got out on all occassions, the averages for the two batsmen are - Kallis - 40.00; Dravid - 38.57 ... So Kallis was better than Dravid for the 1997 season.
In 1998, Kallis played in 30 matches to score 1000 runs (at an avg of 33.33) while Dravid featured in 16 matches to score 500 runs (at an avg of 31.25). For the second time, Kallis beats Dravid with a better average.
Now, just combine the numbers. So,
Kallis ........ Matches = 44 (14+ 30); Runs = 1560 (560+1000)
Dravid ..... Matches = 51 (35+16); Runs = 1850 (1350+500)
Relook the averages .... Jacques Kallis is now at 35.45 runs/match while Rahul Dravid has an average of 36.27 runs/match. Hence Dravid is a better pick (and averages is not as powerful a statistic as is expected to be)
2. Extra credits - Peculiar to baseball, the batter is scored as per 'runs'. So you come out to bat and there is also a player standing on base 1. And you hit a 'home run' ... both you and the man at base 1 collect one run each. Howzzat !!! You do the fantastic work of hitting the home run and the free-rider also collects the same points for just being on base 1.
In cricket ... similar parallels in getting out on a run-out, mis-field off bowlers, missed chances etc. are never considered in the algorithms.
The entire attempt to bring the games down to numeric equations has many an advantage. The approach pins the relative importance of the contributions that players with different talents, can make to a team's overall performance.
Ofcourse, this doesnt mean there isn't a lot of skill involved in any sport, cricket or baseball. Nor does it mean that some players aren't better than others. Statistical tools are fantastic aids in guiding team fortunes and in predicting trends which can be rectified or improvised for success.
Bookmark this post: |
|
Saturday, March 4, 2006
Nahar Exports
Nahar Exports Ltd. stats are enclosed -
Share Capital - 35.08 crs
Loans - 144.81 crs
Investments - 116.24 crs
Net CA - 184.18 crs
LY Profits - 23.22 crs
FV - 10 rupees per share
Dividend - 1.5 rupees per share
CMP - 70.80 rupees per share (3-Mar)
On the basis of the above, I find -
a) NCA (excluding invt) comes to 11.23 rupees per share
b) Dividend yeild is at 2.12%
c) P/E ratio (on LY profits) is 10.69
Also discovered ....
a) Breaking the investments further, I find that a lions share of those investments are held in Nahar Spinning (71,22,930 shares) whose current price is at 214 rupees/share (3-Mar). This means the market price of investments is atleast 152.43 crs from Nahar Spinning itself. Add to it the 21.3 crs, the company has invested in income/liquid funds .. final investment numbers come to 175.56 crs or, 50.04 rupees per share.
b) So your NCAV is at - 52.50 (from net current assets) + 50.04 (from investments) - 41.27 (from loans) = 61.27 rupees per share.
NCAV at 61.27 rupees per share .... CMP at 70.80 rupees per share ....
c) The disturbing aspect of this company is the reduction in Q on Q sales (10% drop in sales), although the profits have gone up. I would estimate an yr closing at 36 crs of PAT ... i.e. a fwdP/E of 6.90.
d) Some peer-estimates (Jan data of P/E ratios):
Abhishek Inds [13.86] . . . . . . Aditya Birla Nuvo [32.95]
Alok Industries [10.74] . . . . . Arvind Mills [12.20]
Bombay Dyeing [21.68] . . . . . Century Enka [12.58]
Forbes Gokak [19.41] . . . . . . . Garden Silk [19.38]
Himatsingha Seide [26.97] . . . Indo Rama Synth [12.26]
LMW [26.19] . . . . . . . . . . . . . . Mahavir Spinning Mills [12.29]
Rajasthan Spinning [9.82] . . . Raymond [24.45]
SRF [25.26] . . . . . . . . . . . . . . . Welspun India [17.37]
Nahar Exports has the least P/E of all it's peers.
The scrip looks enticing at these numbers - it has a decent dividend yield, is very close to it's NCAV and has the best P/E ratio in the industry. However the negative sales growth rates is a trade-off you might have to live with. I would recommend small quantities at this price with a stop loss at 60 rupees. The next movement in the price is expected after the Q4 results are out.
PS: I am deviating from the Buffett notion of "I'll-buy-more-when-prices-go-down" for this stock as the PAT is periliously close to my 10 crs PAT per quarter principle. I'd be more comfortable buying more on a lowering stock price if the PAT was somewhere over 20 crs per quarter (makes me more comfortable). Since this one is not in that domain, hence the stop loss.
Bookmark this post: |
|
Friday, March 3, 2006
The Crazy Math of Airline Ticket Pricing
A~ in his comments, had posted a link on a most fabulous article on - "The Crazy Math of Airline Ticket Pricing" - an insight on how airline seat prices have nothing to do with the distance of travel. The article reflects on the fact that, there are a number of reasons why airline ticket prices are priced the way it is. Surprising, distance is hardly a factor here.
The reasons have been enumerated here -
a) It's the demand and supply for a seat from point X to point Y which determines the price of the ticket.
b) Attract customers from other airlines or other modes of transportation like the railways
c) Offer discounted airline fares as a loyalty programme
The article says ... "The problem was that all the different pricing rules interact in ways that not even those who designed the pricing systems could begin to fully understand. Mathematically, this made the (idealized) problem of finding an optimal fare between two given locations undecidable, which means that it is impossible to write a computer program to solve the problem."
Linking this irrationality to some news stories from the stock market which have been featured in earlier posts -
1. Infomedia offered a buy-back offer of 245 rupees, on a day when the stock price was only 196 rupees. (The promoters could have just purchased back the shares from the market at 196 rupees)
2. Suzuki sold it's stake in TVS Motors at 16 rupees per share, while the market price at that time was rupees 90.
3. The HLL stock going down by 20% while P&G moved up by 10% - while both firms reduced prices by the same margin. (and HLL was more profitable with greater cash reserves)
Irrationality is everywhere .. in stock markets, airline industry, hotel industry ... even cricket !!! ... imagine Greg Chappell inviting inexperience youngsters to the side while Ganguly, VVS, Sehwag, Kumble might be sidelined - inspite of having better averages, better man-of-match performances per match, better strike rates and better experience. Debatable, but appalling.
Bookmark this post: |
|
Thursday, March 2, 2006
Jai Corp
There are two striking things about Jai Corp Ltd.'s balance sheet -
a) It has a net current asset of 140.56 crs (i.e. 162.9 rupees per share)
b) It has investments of 57.87 crs (i.e. 67.1 rupees per share)
Add a) and b), you find a Grahamian NCAV at 230.0 rupees per share. The stock is available today (Feb-26) at 109.90 on the NSE - a discount of 52.21% on the NCAV !!!
On further examination of the investments, the company has been a rather decent participant at the stock markets. As of 31-Mar-2005, it held the following shares :
1. Bharati Shipyard - 10728 shares - Today: 383 rupees = 0.41 crs
2. Jet Airways - 8592 shares - Today: 964 rupees = 0.82 crs
3. ONGC - 159975 shares - Today: 1175 rupees = 18.79 crs
4. PNB - 11199 shares - Today: 452 rupees = 0.51 crs
5. Indraprastha Gas - 110000 shares - Today: 138 rupees = 1.51 crs
6. TCS - 33538 shares - Today: 1687 rupees = 5.65 crs
Thus, the total quoted investments itself comes to 27.71 crs i.e. rupees 32.1 per share
A discount of 52.51% on NCAV - seems a cropper !!!
What I dont like about the stock?
a) Reducing Q-on-Q sales and profits
b) The company has charged taxes at -1.30, -1.14 and -0.52 for the three quarters of this year
c) The company is striving to get it's cash liquidity in place
See Chart (you'll be surprised that the stock has not gained much over the last 1.5 years, while the market has gone crazy .. including peers of Jai Corp Ltd.
Im confused on this one !!!
Bookmark this post: |
|
Unusually mutual funds
I recently read many a reports published by international fund houses where they say, "we are going slow on India ... the breakneck speed of growth in foreign institutional investments in India is over ... we will continue investing in India but it'll be marginal of what was seen in the last two years ...."
Some people may agree, some may not ... but what should help us decide should not be optimism - but an assessment of other opportunities.
Within India, property is on a roll. People are adopting varied techniques to invest in properties and investment agents are coming up with enticing schemes. There is a current commodity bull (In an article, Marc Faber said that the bull run in commodities will continue till 2015) also.
Outside India investments is another area worth exploring .... read on. I've heard of the fantastic appreciations in property in the Gulf area esp. after expatriates have been allowed to purchase some property in UAE. If you are in Qatar, nothing better than buying Qatar petroleum. The US stocks are also seeing a wonderful surge. Property in Japan is on the rise after a decade of descendency.
I am picking one such investment which is Indian, yet alien of sorts.
Imagine a mutual fund based based on the Indian markets, with zero withholding taxes (conditions apply), zero entry load and unbelievably, 100% principal protection. It does exist, but in US dollars.
The Maharaja Note is an offering by ABN Amro N.V. The product is a 6 years maturity structure, USD denominated with 100% capital protected at maturity. It offers 80% participation in a basket comprising 50% HSBC GIF Indian fund and 50% JP Morgan Fleming Indian fund. The fund has done exceedingly well and is currently on an NAV of 144.50 i.e. 44.5% return on investment in the last 16 months.
I find this note very very interesting because this has been created for the extra-conservative investor (people like me). Two major reasons, why -
a) It gives you a 100% principal protection when held till maturity
b) The NAV is not calculated in the normal (Indian mutual fund) way. The fund follows something called the Asian indexing option i.e. the 6 yr period is divided in 24 quarters and the applicable NAV when you are exiting the fund is the arithmetic mean of all previous quarters. E.g. if the NAV for Q1 is 103, for Q2 is 110, for Q3 is 106 and for Q4 is 104 ... then the applicable NAV (if you are exiting) will be (103+110+106+104)/4 = 105.75. Some people may ask - why is that important? Imagine, you are removing the money, right after Q4 ... you would have got 104 dollars only. But because of the Asian indexing, you get 105.75 dollars. (so this is a trade-off, of sorts)
No risk !!! Thing again. Perhaps the biggest risk you take here is the movement in the US dollar. Available at around 44.50 rupees, the US Dollar (as most) is set to depreciate vis-a-vis most world currencies. If this turns true, all gains made can be negated by a weak dollar. In other words, for every Rs. 4.45 drop in the USD/INR rate, you lose 10%. In case you feel otherwise, i.e. the US economy will bounce back and actually gain in the long run ... then this is worth a try.
Donot forget to read and understand the term sheet given in the web page.
Though these opportunities have an NRI tag to it ... the indian resident is allowed to invest in some scheme (the RBI does allow USD 25,000 per calendar year to be invested abroad)
Learn more about structured products ... it will absolutely change your perspective of investment options. Start by reading an excellent summary given by ICICI Bank on the various categories of alternate investments it caters to.
You can view some excellent structures on:
1. ABN Amro
2. HSBC
3. UBS (see Luxemborg for maximum options)
Bookmark this post: |
|
Wednesday, March 1, 2006
Reading the fine print - India Glycols
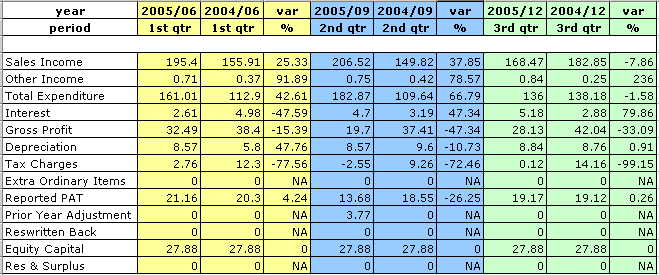
Most investors tend not to look at the notes that come along with each quarterly financial statement. I confess, I am one of 'em. However, after getting some strong advice by Jagadish on the Teledata issue, this is one area i've been trying to evolve in my calculations. A striking example has been seen in the quarterly statements furnished by India Glycols.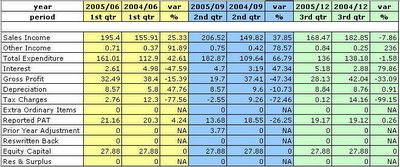 First impressions may read the following numbers -
- Q1 profits of 21.16 crs this yr v/s 20.30 crs last yr
- Q2 profits of 13.68 crs this yr v/s 18.55 crs last yr
- Q3 profits of 19.17 crs this yr v/s 19.12 crs last yr
Which means, India Glycols is partially short in it's nine month performance numbers (a PAT of 54.01 crs this yr v/s 57.97 crs last yr). At 2,78,80,000 shares (FV of 10 rupees/share), the nine-month EPS should come to 19.42 rupees/share.
Now read notice note no. 4 in the quarterly report - it reads .. "Income Tax liability (excluding deferred tax Rs. 336 lacs) for the quarter works out to Rs. 455 lacs and for the nine months will be Rs. 1208 lacs (excluding deferred tax Rs. 444 lacs). Full year tax liability (excluding deferred tax ) is estimated at about Rs. 629 lacs. Considering the substantial variation in the quarterly Tax provisions, it has been decided to provide for tax (including deferred tax) at the end of the year."
In simpler terms, India Glycols paid a tax of 35.2 crs on a gross profit of 117.4 crs ... i.e. 30.2% tax on PBT. This yr, the 9 month PBT comes to 80.33 crs, which should be a tax of 24.1 crs. So far the company has provided for zero tax. Extrapolating the numbers available, I would estimate the PBT for Q4 at around 35 crs (which is a little over the median). Less depreciation to this at 8.5 cars and the tax at 24.1 crs .... India Glycols should put up a result of just rupees 3 crores as it's quarter 4 PAT.
This is one stock about to take a beating for this !!!
The revised EPS on the basis of this info for the year (all 12 months) should be 20.5 rupees/share. And hence the P/E ratio would be 8.85.
This is a classical example of the things retail investors miss out on.
Bookmark this post: |
|
Time to pack your bags
Yesterday, we had some excellent holiday packages circulated by our internal communications department through email. Largely India, there were some great deals on visits to Manali, Shimla, Shirdi, Kerala, Kumaon etc. I liked the Goan package :-)
The hotels and tour operators were offering a drop-down of upto 20% on all charges which was rather enticing. This made me wonder ... if at any given time, there are people in a hotel who stay at full price and also those how donot pay as much (i.e. they have a discount of 20% or even 30%) ... how in the world, does the hotel arrive at the logics to determine the number of rooms, it wants to keep at a discounted rate.
I found this a very interesting and logical exercise.
Some things to ponder on -
1. When the hotel rents the room at a price below the 'card price' then the hotel is at a risk of losing potential revenue on account of -
a) it's possible that the customer would have paid the card rate, as he desperately needs a room
b) demand for that day might have been more than the supply, and all rooms could have been occupied at the card rate, or
c) if the hotel over estimates the number of people who would rent at a lower rate
2. The second aspect of the problem is : how much should be the card rate at the hotel? It's truly possible that the current 'card rate' might actually be a perceivably discounted rate for the customer. What is the deemed logic for arriving at the 'card rate'?
Bookmark this post: |
|