
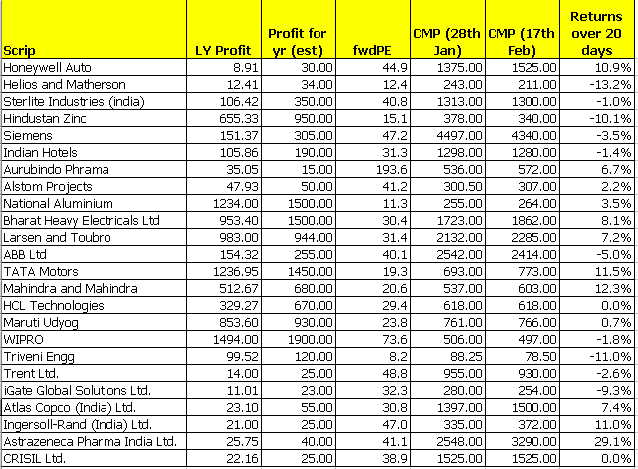
Three weeks back, I picked out a set of 24 stocks in order to arrive at certain patterns on overheated stocks (i.e. stocks to avoid now - which is as important as picking up the right ones). The list of 24 were on the basis of the biggest movers of the month and necessarily with an m-cap of 500 crs and above.
The following measures were estimated on the basis of the data available -
a) Profit for FY 2005-06 (on the basis of 3 quarters of results)
b) CMP of the stock on Jan 28th 2006 and as on 17th Feb 2006 (to calculate the fwdPE and movement in share price over the 20 day period)
The list is enclosed for your persual -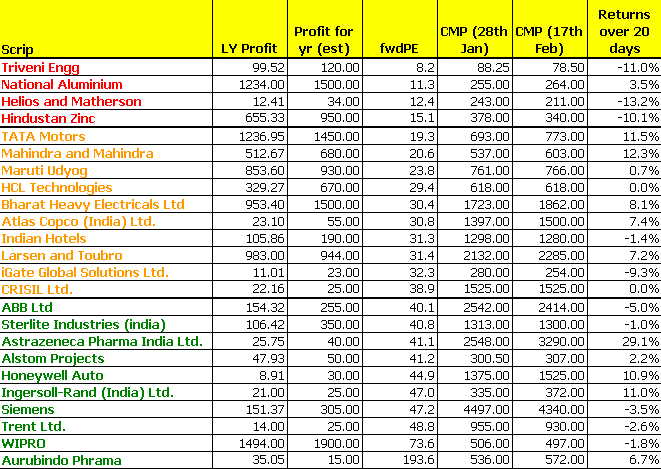
Some interesting patterns were observed.
1. Of the 10 stocks (out of 24) which had a P/E of over 40 - surpisingly only 5 stocks fell over the last 20 days, while 5 stocks actually gained thereby pushing up the fwdPE of the scrip. Shockingly, the ones that fell were within the 0-5% band while the ones that rose grew at ... 10.9%, 6.7%, 11.0% and a huge 29.1%.
2. Of the 10 stocks between a fwdPE of 20 to 40 - only two stocks went down, 6 of 'em went up while 2 remained at status quo.
3. Surprisingly, of the 4 stocks whose PE is well below the market P/E - THREE have actually performed worse at reduction in value of 13.2%, 10.1% and 11.0%.
It's as if, the market is punishing companies which are available at ridiculously low P/E and actually rewarding companies which exhibit a higher P/E.
Is this the elated Mr. Market at his very best?
We need some answers here ... fast !!!
Thursday, February 16, 2006
Overheated stock and the 20-day test
Bookmark this post: | 
|
Subscribe to:
Post Comments (Atom)
No comments:
Post a Comment