
The term "Cash is King" has a wikipedia entry. It reads, "Cash is king is an expression sometimes used in analyzing businesses; it refers to the importance of cash flow in the overall fiscal health of the business ... A company could have a large amount of accounts receivables on its balance sheet which would also increase equity, but the company could still be short on cash with which to make purchases, including paying wages to workers for labor. Unless it was able to convert its accounts receivable and other current assets to cash quickly, it could be technically bankrupt despite a positive net worth."
An interesting article appeared on the importance of cash on CNBC-TV18 (here), which claims that about 70% of companies reported a drop in net cash flows from operating activities. This is crucial because a strong operating cash flow pays for all capex requirements of the organisation and dividend to shareholders. If cash from operations declines for a company, then it might have to borrow from the market to finance it's growth plans. Given the current rate of interest, this is a double whammy - and needs to be factored into every stock evaluation.
Largest Build up in Cash Flows :

Biggest Drop in Cash Flows :

Note: I checked Pfizer (here). The net cash from operations is 17 crs and not 23 crs as stated in the article. There has been some extraordinary earnings for Pfizer which may change some variables in calculation of cash flow (i think, but not certain) .. so I'll not delve into it for now. To illustrate an example outside this list, Hero Honda's net cash from operations slipped from 936 crs in FY06 to 625 crs in FY07. In the same period, profits dropped mildly from 971 crs to 857 crs.
Net net, the importance of cash from operations cannot be ignored. This is the lifeline of most businesses and any decline in these numbers should be looked with the minutest precision before allocating your capital for these stocks.
If you like this content, then do check out my new blog on investing and stock markets for lots more information on the Indian equity markets
Tuesday, May 13, 2008
Cash is King !
Bookmark this post: | 
|
Thursday, April 24, 2008
Eastern Silk
This stock pick has gone wrong for me ! (thankfully, it was not in my stock recommendations on this blog)
Eastern Silk today fell by 14.2% on the bourses. The reason : a Q4 loss of 15.63 crores (here). This follows 5 straight quarters of profits (18.40 crs, 15.46 crs, 19.02 crs, 21.18 crs, 25.52 crs).
What is scary is the drop in sales. From about 168 crores of sales last quarter, the sales have dropped to a mere Rs. 31.3 crores for this quarter.
I had bought Eastern Silk at 265 rupees a share. The current price is Rs. 179. The current PE is 3.48, BV is 211 rupees, EV/EBIT is just 2.8. (all three metrics are pretty encouraging)
What should be the next step ... does it make sense for me to wait .. or immediately sell off?
Bookmark this post: |
|
Wednesday, April 12, 2006
Why panic?
The sensex fell 300 points on 12th April and another 100 points on 13th April ... and people are saying all kinds of things. Some important facts -
> the market has gone down by just 3.44% over the last two days. This is much better than those days when some of our stocks have gone down by 10% or more.
> a 400 pt drop reduces the current sensex P/E by almost hundred bps. So this should be at 19, right?
> corporate profits have improved over time ... nothing drastic has happened in terms of reduced exports, still higher fuel prices (it's remained the same over the last three quarters), global downturn. Infact exports have jumped, global economy is also on a high, real estate, gold prices and commodities are increasing .. things are getting better. Now an improvement in corporate earnings by 10%, would result in a reduction of PE by 180 bps. So your PE will go down to 17.20. If corp earnings is up 15%, then PE is 16.35.
It's my opinion, that the market will be upto 12000 by the end of May. Watch !!!!
Bookmark this post: |
|
Monday, March 20, 2006
It's getting better all the time
I'll be closing 2 years of investing on the equity markets this 31st March. Confession - I have made much less money than what an index fund would have given. But have learnt a lot in the process. How I missed many an opportunities? And again missed the same opportunities? When to sell and not to sell? Buy or not buy and buy how much? Im still ridden with a number of stocks which have dimished 40%+ in value.
OK, this may be amusing ... the first ever stock I bought on the equity market was Padmalaya Telefilms and this was also the very stock I sold off at a loss ... a loss of 63% from cost.
But the truth is: I am very much getting better at this. In evaluating companies, on the right time to buy, am seeing more in the B/S and P&L and the importance of news and volumes. My choices and recommendations in the last one month have been much better than ever before.
> Amtek India in 37 days, is up 18%
> Gujarat NRE Coke in 33 days, is up 10%
> Aftek Infosys in 3 days, is down by 1%
> Ind Swift Labs in 1 day, is up 16%
Bookmark this post: |
|
Monday, February 20, 2006
Change is good
The recent change in conditions at HCL Infosystems is a good example of how any change in the 4Ps (price, place, product, public) can dent or raise a stock's going price.
To illustrate -
Say HCL Infosystems. Upon viewing the Q1 + Q2 data, I find that the change in agreement with Nokia, means the company has dented it's revenue numbers (ceteris paribus) by 40.12%. The new revenue number will be 3041 crores (i.e. 50% of 4074 crs from their telecom business plus 1004 crs from other businesses). The PBT would come to 115.5 crs - a dent of 32.06%. If I were to not question the fact that the HCL Infosystems stock is overly/fairly/under priced, the HCL Infosystems stock should have been at anywhere betwee 32% to 40% i.e. from a price of 259 rupees ... the fall should lie between 155 rupees and 176 rupees.
The stock had an intra-day low of 145 rupees and it closed at 180 rupees. Pricing anamoly.
A more interesting example can be seen in the 2004 HLL-P&G price war where P&G initiated a price war by reducing the price of popular detergents by 25%. As a response, HLL followed suit with a 25% reduction in prices. The P&G scrips were at 405 on the day of the announcement and HLL stock was quoted at 174 rupees.
Surprisingly the P&G stock went upto 433 rupees by the first week of May (see charting) while the HLL stock actually reduced from it's levels by a good 18% till the first week of May (from 175 rupees to 142 rupees; HLL touched a low of 105 rupees on August 16th, 2004).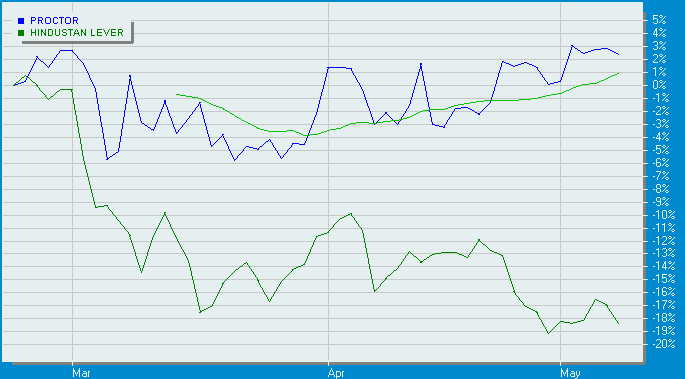
Same industry. Same reduction in price. Same effect to profitability. And yet, the 4th P (public) made a different inference.
But that's not the point .... Analyse this !!!! Detergents contributed only 24% to the total revenue of HLL. Which means the 25% reduction in price should have brought down the revenue by only (25% mult by 24%) ... 6%, but the market actually drilled down the HLL price by exactly the same amount of price cut i.e. TWENTY FIVE PERCENT.
A clear anomaly in understanding "impact on profitability".
Value investors kept on buying this stock as soon as it went below the price of 150 rupees. Easy money. Watch out for such opportunities !!!!
Bookmark this post: |
|
Thursday, February 16, 2006
Overheated stock and the 20-day test
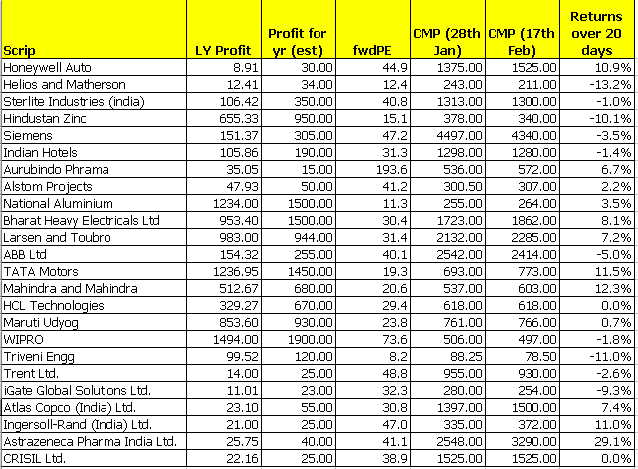
Three weeks back, I picked out a set of 24 stocks in order to arrive at certain patterns on overheated stocks (i.e. stocks to avoid now - which is as important as picking up the right ones). The list of 24 were on the basis of the biggest movers of the month and necessarily with an m-cap of 500 crs and above.
The following measures were estimated on the basis of the data available -
a) Profit for FY 2005-06 (on the basis of 3 quarters of results)
b) CMP of the stock on Jan 28th 2006 and as on 17th Feb 2006 (to calculate the fwdPE and movement in share price over the 20 day period)
The list is enclosed for your persual -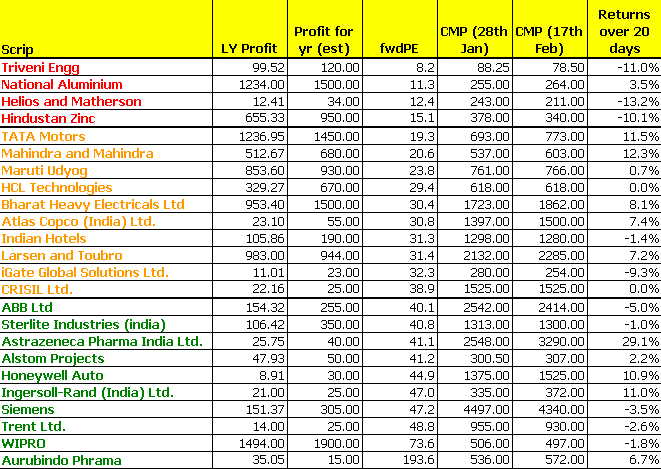
Some interesting patterns were observed.
1. Of the 10 stocks (out of 24) which had a P/E of over 40 - surpisingly only 5 stocks fell over the last 20 days, while 5 stocks actually gained thereby pushing up the fwdPE of the scrip. Shockingly, the ones that fell were within the 0-5% band while the ones that rose grew at ... 10.9%, 6.7%, 11.0% and a huge 29.1%.
2. Of the 10 stocks between a fwdPE of 20 to 40 - only two stocks went down, 6 of 'em went up while 2 remained at status quo.
3. Surprisingly, of the 4 stocks whose PE is well below the market P/E - THREE have actually performed worse at reduction in value of 13.2%, 10.1% and 11.0%.
It's as if, the market is punishing companies which are available at ridiculously low P/E and actually rewarding companies which exhibit a higher P/E.
Is this the elated Mr. Market at his very best?
We need some answers here ... fast !!!
Bookmark this post: |
|
Thursday, January 5, 2006
Oil prices - where is it headed?
Increase in oil prices always has an inflationary effect on the economy. Worse still, this effect pans across the globe affecting each country which has energy requirements. Consulting firm, Delloites has some good views on the rising oil prices. The most striking part of the article posted in their website was on reasons why the world economies have been able to withstand the rise-in-oil-price blow. Here's their view-
1. A number of economies are not dependent on energy driven sectors like manufacturing alone which is true fro countries like the US and India where services is the predominant sector over agriculture and manufacturing whose energy requirements are higher. 2. The price of oil is not as high as it was in the late 1970s and early 1980s when adjusted for inflation. I have put together a graph on the same. Infact the highest price of oil per barrel was $80.69 in Feb-1981 and lowest point being Dec-1998 when the price of oil was just 9.3 USD to the barrel and the inflation-adjusted price was 11.47 USD. From there the price of oil has come a lot, but not equal to what it was 25 years back
3. There has been a decline in the value of the dollar. This means, the price you pay for one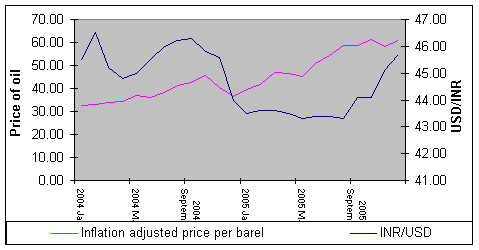 barrel of oil will come down if the USD/INR exchange rate has gone down ceteris paribus. E.g. Between Oct 2004 to Dec 2004, the USD fell by almost 4% and the oil prices too fell by a sparkling 19%. Thus the impact on the oil bill was -
Oct 2004 - Cost of purchase of 1 barrel = 2020.38 INR
Dec 2004 - Cost of purchase of 1 barrel = 1554.96 INR
4. There was also a time lag between people awakening to the fact that the rise in oil prices was not a temporary blip. It often happens across all industries and almost all situations.
5. Another striking part of the oil price rise, is that this one is demand-driven rather than it being supply driven. The larger consumers of oil are developing countries like India and China. With their economies growing at 7+%, these people will not raise a hue and cry over it.
All this may reverse if the following happen -
- China, India grow into energy guzzling monsters
- The USD for some reason appreciates vis-a-vis other currencies. (this will raise the import bill of oil for all countries)
Bookmark this post: |
|
Saturday, December 31, 2005
The stories behind stock market crashes
A very interesting story was featured in Ankur Jain's blog. It's a bit long but harps on the following points -
a) A crash is the product of knowledge known to many
b) Ever increasing greed only hastens the inevitable crash
c) Bubbles are there everywhere - some see it, some don't
Another interesting aspect to the same was also found in Sanjay Bakshi's blog. The most interesting aspect is how naive people can be and follow the crowd. Check this out aswell. Here's to all cheaters ...
Bookmark this post: |
|
Are the markets set to tank
A question that most people are asking today. Markets are ideally guided by a lot of sentiments so I decided to fill in some numbers to check this out.
I randomly picked 170 midcap stocks (m-cap of 100 cr to 2000 cr; profitable cos.) comprising a total of 93,000 crores of m-cap. My immediate focus was an understadning of the P/E ratios of the stocks. The total weighted P/E (factoring in the m-cap of each stock) came to 31.6. This is mighty expensive.
I did a second analysis of m-caps .. this time of only the top 20 stocks (in m-cap terms) .. the P/E was 26.4. Again high.
Also let's see the rise in stock prices over the last one yr in these top 20 stocks (weighted for the m-cap aswell) - 108.18%. The profits of these cos. have increased by only 26% overall. Some people may say that these stocks were undervalued. Possible, but equity markets donot move on the whims and fancies of individual stocks. Let me prove this to you.
Look at the last one week data - the list of top gainers. Not one A cat company in the top 20 list, just two B1 cos. And yet the market was up a strong 250 points. Now in that list, the number of penny stocks (negative profits / P/E of greater than 50) - 8
Still ready to invest or, perhaps revel in cash .... !!!
Bookmark this post: |
|
Monday, January 1, 2001
Archives
Companies mentioned in this blog :
Abbott India
Abhishek Industries
Aftek Limited
Albright Wilson Chemicals India Limited
Alembic Pharma
Amtek India
Andhra Cement
Andhra Pradesh Paper Mills
Birla Corp Limited
Bhagyanagar India
Bimetal Bearings
Cheviot Company Limited
Eastern Silk
Electrosteel Castings
Elgitread India
FCS Software
Fem Care Pharma
Graphite India
GNFC Limited
GTL Limited
Gujarat NRE Coke
HCL Infosystems
HEG Limited
Helios and Matheson
Hexaware Technologies
Hindustan Constructions Company
Hotel Leela Ventures
ICSA India
India Glycols
India Nippon Electricals
Ind Swift Labs
Investment and Precision Castings
Jai Corp
JK Paper
JSW Holdings
KRBL
Lloyd Electric and Engineering Limited
Lok Housing and Constructions Limited
Macmillian India
McDowells Holding Limited
Merck Limited
Micro Inks
Motherson Sumi Systems Limited
Motilal Oswal Financial Services
MRF Limited
Mukand Limited
Munjal Auto
Nahar Export
Nahar Industrial Enterprises
NIIT Technologies
NOCIL
PNB Gilts
Polaris
Prajay Engineers Syndicate
Pricol Limited
Pyramid Saimira
Rain Calcining
Ruchi Soya Industries
Sandesh Limited
Sarda Energy and Minerals Limited
Satyam
Savita Chemicals
Sical Logistics
Siemens India
SKF India
SRF Limited
Star Paper
Sundaram ClaytonSu-Raj Diamonds
Teledata Informatics
Titan Industries
Torrent Power SEC Limited
Unichem Labs
Vardhman Holdings
Videocon Appliances
Visa Steel
Visualsoft Technologies
West Coast Paper Mills
Bookmark this post: |
|